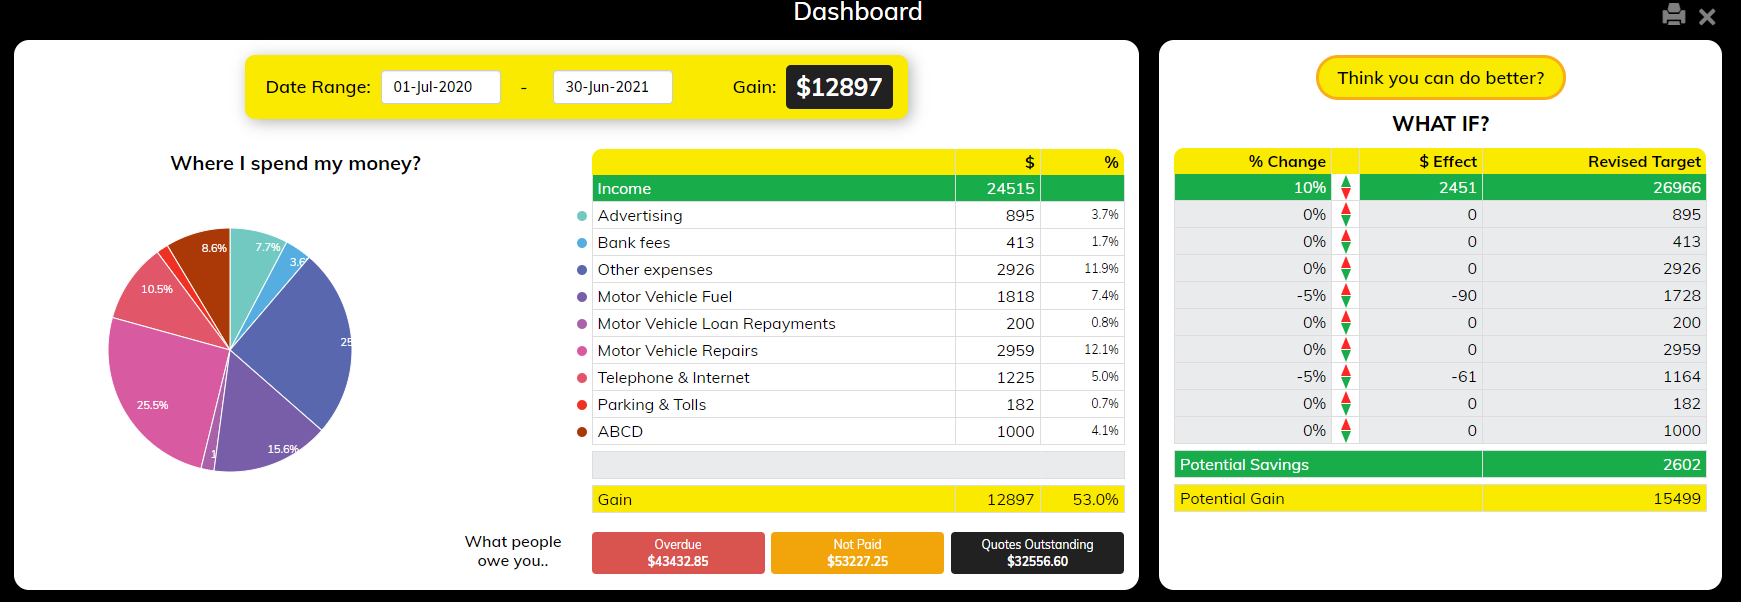
 Your Performance Dashboard shows you a snap shot of where you are at with your business. If you're diligent with your transaction processing then you should be viewing a current financial view of your operations.
The Dashboard will display your results for a specified Date Range.
Hover over the Pie Chart to get more details on your expenses.
Your Summary result comes with Income, Expenses, and the percent your expenses and profit form of the total mix. You can use this to identify excesses in spending or realisation of bad sales pricing on your invoicing. Look also at your profit margin, that's the percentage at the bottom, and make sure you determine what percentage number you should be focused on. As an indicative range (depending on the market you serve), you should be looking for percentages between 5% to 20%.
It also displays who OWES you money, including any OVERDUE Invoices with any QUOTES that you may have outstanding. Awareness and action of overdue Invoices are vital to maintain a healthy cashflow. .
What If Table
To the RIGHT hand side of your Performance Dashbord is a handy WHAT IF table. Adjust the % Change to see what effect it would have on your Profits, providing insight into the allocation of your resources.